The Shanghai Stock Index has been on a down trend since the latter part of 2007. By closing below 2000 yesterday at 1999, it is in danger of making 5 year low. The German stock market had been racing to new high side by side with the US market since March of 2013, but formed Double Top pattern at the end of February 2014. Even though stock markets of different countries go different ways sometime, but when important markets are not doing well it tends to impact other markets negatively. In this case, both the Chinese and the German markets are in trouble and the US market is not likely to escape unharmed.
6 month chart:

10 year chart

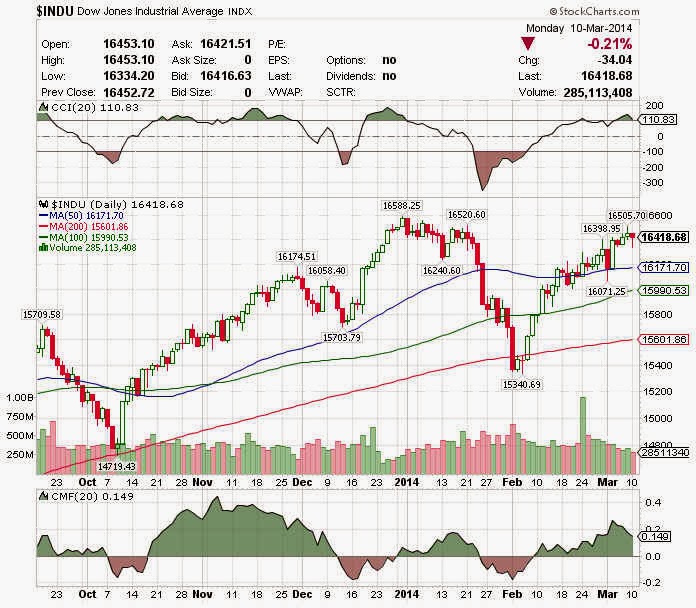
After making all time high 16588 last December, the Dow Jones Industrial Average dropped 7% in January this year, it then made a quick V-shape reversal and is close to all time high level 16588 again. The Dow has moved too fast and too much and when the market is over bought and near resistance, it is tough to break resistance. For this reason, the chance for the Dow to form bearish Double Top pattern is good.
The Dow Jones Industrial Average:
Fundamentally, weak economic data from the last 2 months have been hurting the Chinese market while concern over European economy and the lingering, unresolved Ukraine situation have capped the German market's advance. Even though the US economic data have been holding up firm lately, but if the world economies are tied, it won't be long when the weakness comes around to the US.
Sentimentally, newsletter advisors remain stubbornly bullish at extreme levels. Recent Investor Intelligence survey levels came in at 55% bulls and 15% bears. This translate into a bull percentage of 79% (55/(55+15)x100) and is in extreme complacency zone. Stock market usually reverse down at this level historically.
So, watch out!
Investor Intelligent Bull Ratio and S&P 500:


No comments:
Post a Comment