Thursday, September 30, 2021

What Next For The Stock Market 股市下一步怎走

September is still keeping its bad name as the worst month of a year for the stock market as Dow, Nasdaq and SP500 dropped 8.5%, 5.5% and 3.9% in September respectively. Here is a look of these major market indexes:

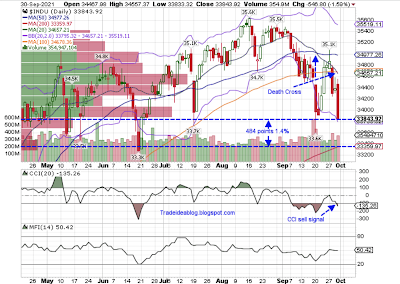
The Dow is 5% below its all time high level 35631. It has two bearish death crosses on its daily chart. CCI dropped below -100 is a sell signal. It is below 20,50 and 100 dma, so its short and intermediate trends are now down. It is now 484 points, 1.4% above its 200 dma at 33360. It looks ready to test it since it is so close.


The Nasdaq Composite is below its all time high level 15403. In the daily chart, $compq is below its 20, 50 and 100 dma, and its short and intermediate trends are down. The next level to challenge is 200 dma at 13950,  and it is 499 points, 3.5% below the present level at 14448.


The S&P 500 is 5.2% below its all time high 4546. Its 20 dma is crossing below its 50 dma forming a bearish death cross. CCI dropped below -100 is a sell signal. It is also below 20, 50 and 100 dma and its short and intermediate trends are down. Its next level of support is 200 dma 4135 which is 173 points, 4% below the current level of 4308.


Since the Dow is the closest to its 200 dma 33360 and this level will likely be tested near term. And it is likely serve as the market's support. The market will likely bounce when this level is touched. After finish bouncing, the market will likely proceed to test the 200 dma of S&P 500 at 13950 since it is the second closest. It this level fail to hold, the Nasdaq Composite 's 200 dma l3950 will be tested. 


由于道指、纳斯达克指数和 S&P500 指数在 9 月分别下跌了 8.5%、5.5% 和 3.9%,9 月仍然保持是股市一年中最糟糕的月份坏名声。以下是这些主要市场指数的现时情况:

道琼斯指数目前比历史高点 35631 低 5%。它在日线图上有两个看跌的死亡交叉。CCI 有叠穿-100的卖出信号。它也低于 20,50 和 100 日平均线,其短期和中期趋势现在为下跌。它现在高于 200 日均线 33360 1.4%,484 点。它看起来已经准备好测试200 日均线,因为它是如此接近。


纳斯达克综合指数低于其历史高点 15403 6.2%。在日线图上,$compq 低于其 20、50 和 100 日均线,其短期和中期趋势均为下跌。下一个挑战水平是200日均线13950水平,它是比现在的水平14448低3.5%,499点。


标准普尔 500 指数比历史高点 4546 低 5.2%。其 20 日均线下穿 50 日均线,形成看跌的死亡交叉。它同时有CCI向下穿-100的卖出信号。它也低于 20、50 和 100 日均线,其短期和中期趋势正在下跌。它的下一个支撑位是 200 日均线 4135,比当前水平 4308低 173 点,4%。


由于道指最接近 200 日均线 33360,该水平可能会在短期内受到测试。它很可能成为市场的支撑。当触及该水平时,市场可能会反弹。完成反弹后,市场可能会继续测试标准普尔 500 指数的 200 日均线 13950,因为它是第二最接近的。如果这一水平守不住,纳斯达克综合指数的 200 日均线l3950 将受到考验。

Tuesday, September 28, 2021

A Confluence Of Factors For Market Correction.市场调整因素的汇合

Major US stock dropped sharply today with the Dow, S&P500, Nasdaq Composite and Russell 2000 dropping 569.38 (-1.63%), 90.48 (-2.04%), 423.29(-2.83%) and 50.06 (-2.19%) respectively. The reasons for the sharp pull back are rising treasury yields, rising oil prices and weakness in Asian and European markets. The worrying part of today's market action is major indexes are all closed near today's lows. There were buy-on-dips during the trading day, but sell on rallies have been pushing the market back down. Another bad thing for the market is all major market indexes are now below their critical 50 day moving averages and this is a severe technical damage for the market. The market is now having sell signal and follow through to the downside is likely. A confluence of negative fundamental events are also appearing which are raising concerns, they are:

1. Federal Reserve believes situations are ripe for reducing bond purchasing. Markets are starting to reflect Fed tapering. US Treasuries have been down 4 days in a row ( treasury yields have been up the last 4 days). Deutsche Bank analyst Jim Reid believes we are now entering the most aggressively global hiking cycle in a decade. Investors have been following the Wall Street moto of don't fight the Fed and have been buying stocks as Fed apply easy monetary policy.  When the Fed starts to tighten, should investors follow the moto by selling stocks?

2. The Chineses government have been clamping down on industries with increased regulations on  high techs, real estate, gaming, education etc.in the last few months. These have the effect of weakening its economic growth. Analysts have been lowering estimates for Chinese GDP. Goldman Sachs lowers Q3 Chinese GDP growth from previous estimate of 1.3% to 0. The weakening growth of the world's 2nd largest economy definitely will drag the global economy with it. 

3. The global energy crunch has been pushing oil price up. US crude oil price moved from August low of 61.82 to today's high of 76.67, a rise of 24% in just a little over a months time. Energy crunch in China is causing factories closing and the result is component shortage. The rise of oil price, higher component prices due to supply chain disruption together with higher cost of labor all point to higher inflation. Higher inflation together with lower growth is stagflation and is not easy to fix. 

4. According to Data Trek Research, Q3 earnings estimate for the S&P 500 has been falling. Weaker earning reports going up are not going to be good for stocks.

5. The trailing 12 month PE for the S&P 500 is now at 33.95 and is the 3rd highest in history. It is also much higher than the historic median of only 14.86. The Buffet Indicator is now at 239% and is higher than the historical average by 91%. Stocks have been way over value. Up to August 21,2021, total margin debt is $911,545,000,000, highest in history. This makes the stock market very risky. 

Based on the above observations, I think the US stock market will likely have a bigger correction. I don't know when will the correction end, a 10% down from all time high is a good start. Looking at the S&P 500 chart, it gapped below its 50 day moving average at 4444 with a lot of downside momentum. This is a sell signal. Indicator CCI dropped below -100 level is another sell signal. A trip down to its 200 day moving average 4128  looks likely and is 9.2% down from all time high level of 4546. 


今日美股大跌,道指、标普 500、纳斯达克综合指数和罗素 2000 指数分别下跌 569.38(-1.63%)、90.48(-2.04%)、423.29(-2.83%)和 50.06(-2.19%)。大幅回落的部份原因是国债收益率上升、油价上涨以及亚洲和欧洲市场疲软。今天市场走势令人担忧的是主要股指均收于今天的低点附近。今日有逢低买入,但随之而来的是逢高卖出一直在推动市场回落。对市场来说另一件坏事是所有主要市场指数现在都低于它们关键的 50 天移动平均线,这对市场来说是一个严重的技术损害。市场现在有卖出信号,继续下行的可能性大。一系列负面的基本面情况也正在出现而引起了人们的关注,它们是:

1. 美联储认为减少债券购买的时机已经成熟。市场正开始反映美联储的缩减。美国国债连续 4 天下跌(过去 4 天国债收益率都上升)。德意志银行分析师吉姆·里德认为,我们现在正在进入十年来最激进的全球加息周期。投资者一直遵循华尔街的“不与美联储对抗”的策略,并随着美联储宽松的货币政策而购买股票。当美联储开始收紧政策时,投资者是否应该通过抛售股票来实行“不与美联储对抗”呢?

2. 过去几个月,中国政府对高科技、房地产、游戏、教育等行业加大了监管力度。这些都会削弱其经济增长。分析师们都在下调对中国 GDP 的估计。高盛将第三季度中国GDP增速从此前预估的1.3%下调至0增长。当世界第二大经济体增速放缓时势必会拖累全球经济。

3. 全球能源危机推高油价。美国原油价格从 8 月的低点 61.82 升至今天的高点 76.67,在短短一个多月的时间里上涨了 24%。中国的能源紧缩导致工厂关闭,结果是导致零部件短缺。油价上涨、供应链中断导致的零部件价格上涨以及劳动力成本上涨都显示通货膨胀率上升。高通货膨胀加上较低的增长是滞胀,这个问题不容易解决。

4. 根据 Data Trek Research 的数据,标准普尔 500 指数第三季度的盈利预测一直在被调低。疲软的盈利报告将对股市不利。

5. 标准普尔 500 指数过去 12 个月的市盈率为 33.95,是历史第三高。它也远高于仅 14.86 的历史中位数。 巴菲特指标现在为 239%,比历史平均水平高 91%。股票已经是大大超值。截至 2021 年 8 月 21 日,保证金债务总额为 911,545,000,000 美元,创历史新高。这使得股市越发危险。

基于以上观察,我认为美国股市很可能会有更大的下跌调整。 我不知道修正什么时候会结束,从历史最高点下跌 10% 是一个合适的开始。从标准普尔 500 指数图表来看,它跳空低于50天移动平均线4444 水平,具有很大的下行动力。 这本身是个卖出信号。 指标 CCI 跌破 -100 水平是另一个卖出信号。 它很有可能跌至 200 天移动平均线 4128,这是从历史高位 4546 下跌 9.2%。




Friday, September 17, 2021

Larger Stock Market Down Turn Is Coming更大的股市场下跌即将到来

The US stock opened down to day and has continued going down today. Negative factors are: Worries over volatility from quadruple witching today, Fed meeting next week , Biden's tax hike proposal, high market valuation ,September is the worst month for stock in history and year end tax selling. Technically, the Dow, NYSE Composite, S&P 500, Russell 2000, Wilshire 5000 and sector ETFs such as IYM, IYT, IYZ, PPH, SOCL, XLI, XRT and 55% of the S&P 500 stocks are now below their crucial 50 day moving averages.  Also buy on dips are met with larger selling in recent days. Market internals are not healthy. Another blow to the market is the highest capitalized stock AAPL is also below its 50 day moving average.  All signs points to a bigger down turn in the stock market. For the S&P 500, a 5% correction will take it down to 4300, a 6.9% correction will take it down to July low at around 4233 and a 10% correction will take it down to 200 day moving average 4100.


今天美股开盘低开并且一直走低。 负面因素有:今天四魔日波动的担忧、下周美联储会议的担忧、拜登的加税建议、过高的市场估值、9月是历史上股票一年中最糟糕的月份和年终退税抛售。 从技术上讲,道琼斯指数、纽约证券交易所综合指数、标准普尔 500 指数、罗素 2000 指数、威尔希尔 5000 指数以及板块ETF IYM、IYT、IYZ、PPH、SOCL、XLI、XRT 和 55% 的标准普尔 500 指数股票现在都已低于关键的 50 天移动指数平均线。 最近几天,逢低买入虽然活跃但都遇到了更大的抛售。 市场内部不很健康。 对市场的另一个打击是市值最高的股票 AAPL 也失守 50 天移动平均线。 所有迹象都显示股市将出现更大的下跌。 对于标准普尔 500 指数来说,从历史高位 5% 的回调将使其跌至 4300,6.9% 的回调将使其跌至 7 月低点 4233 附近,10% 的回调将使其跌至 200 天移动平均线 4100水平。 


Sunday, September 12, 2021

UVXY Is A Buy And How High It May Reach. UVXY可买入及它可能达到的高度

Many signs point to US stock market correction may have begun. Seasonally, September is the worst performing month for stocks since 1985. Technically,  the large cap Dow Jones Industrial Average ($INDU  34607.72 -0.78%), the broad New York Stock Exchange Composite ($NYA 99.64-0.60%) and the small cap Russell 2000 ETF (IWM 221.62-0.98%) have all  dipped below their important 50 day moving averages. In addition, weakness in tech leaders such as AAPL(148.97 -3.31%), TSLA (736.27 -2.46%) and GOOG (2838.42 -2.07%) are leading the tech sector (XLK 156.63 -0.99%) down. Fundamentally, according to the latest articles from ZeroHedge's "5 Divergences In The Stock Market To Keep An Eye On This Fall" and "10 points on why investors are bearish for the last two weeks of September" and Seeking Alpha top author Lance Roberts's "Investors Hold Record Allocations Despite Rising Warnings", a deeper stock market correction of 5 to 10% seem unavoidable. 


By experience and historic fact the quickest way to rip profit during market drop is none other than buying UVXY (23.86+5.53%), the ProShare Ultra VIX Short-Term Futures ETF. During the course of 2021 so far there were 4 notable S&P 500 dips, they are January 21 to January 27 (-3.9%), May 7 to May 12 (-5.7%), July 16 to July 19 (-3.3%) and August 16 to August 19 (-2.5%). During these market dips, UVXY were up 54%, 57%, 46% and 27% respectively. As a result, the average move ratio between UVXY and S&P 500 is 12.97. This means each 1% drop in S&P 500, the UVXY increases by 12.97%. If we project the S&P 500 will correct down 10% from all time high, there is approximately 8.3% left to drop from Friday's close of 4458.58 and the downside target is 200 day moving average at 4080 level. This means UVXY will rise 12.97x8.3%=107.65% from Friday's close of 23.86 and the projected UVXY target hence is 23.86+23.86x107.65%=49.55. 


September is the worst performing month for stocks since 1985:


Author note:I own UVXY call options.


很多迹象都显示美国股市可能已经开始调整。就季节性而言,9 月是 1985 年以来股市表现最差的月份。从技术上讲,大盘股道琼斯工业平均指数($INDU  34607.72 -0.78%)、广泛的纽约证券交易所综合指数 ($NYA 99.64-0.60%) 盘股罗素 2000 指数ETF (IWM 221.62-0.98%) 都跌破了重要的 50 天移动平均线。此外,AAPL(148.97 -3.31%)、TSLA (736.27 -2.46%) 和 GOOG (2838.42 -2.07%) 等科技龙头股的疲软带领科技股 (XLK 156.63 -0.99%) 下跌。从基本面上看,根据 ZeroHedge 的“今年秋天要密切关注的股票市场的 5 个背离”和“为什么投资者在 9 月的最后两周看空的10个原因 ”以及 Seeking Alpha 顶级作者 Lance Roberts 的“尽管警告不断增加,但投资者仍保持创纪录的股票分配”,这些都显示5% 至 10% 的更深层次的股市回调似乎是不可避免的。


根据经验和历史事实,在市场下跌期间赚取利润的最快方法就是购买 ProShare Ultra VIX 短期期货 ETF UVXY (23.86+5.53%)。 2021 年到目前为止,标准普尔 500 指数有 4 次显着回调,分别是 1 月 21 日至 1 月 27 日(-3.9%)、5 月 7 日至 5 月 12 日(-5.7%)、7 月 16 日至 7 月 19 日(-3.3%)和8 月 16 日至 8 月 19 日(-2.5%)。在这些市场下跌期间,UVXY 分别上涨了 54%、57%、46% 和 27%。以此来算UVXY 和标准普尔 500 指数之间的波幅平均比率为 12.97倍。这意味着标准普尔 500 指数每下跌 1%,UVXY 就会增加 12.97%。如果我们预计标准普尔 500 指数将从历史高点回调 10%,那么距离周五收盘价 4458.58 还剩下大约 8.3%,下行目标是200 天移动平均线4080 水平 。这意味着 UVXY 将从周五收盘价 23.86 上涨 12.97x8.3%=107.65%,因此预计 UVXY 目标是 23.86+23.86x107.65%=49.55。


9 月是 1985 年以来股市表现最差的月份:


作者注:我拥有 UVXY 看涨期权。


Saturday, September 11, 2021

Buy On Dip Is No Longer Working逢低买入已不再有效

The S&P 500 has been down 5 days in a row this week. It is down a total of only 1.7% for the week. During the past 9 trading days it was evident that buy on dips were active, however they were all met by larger selloffs. The overall result is a down market and this means the dip buyings are no longer able to sustain the market's up trend. Friday's drop is the biggest in the last 5 down days. Some of the events that triggered Friday's selloff are: 

1. August Producer Price Index increased for the 8th straight month and year over year increase is 8.3%, the largest 12 month increase since the data were first calculated in November 2010. 

2. Goldman Sachs lowered Q3 GDP projection from August 20 estimate of 5.5% to 3.5%.

3. US Treasuries are down and yields are rising.

4. The Dow Jones Industrial Average dropped below its 50 day moving average 2 days in a row.

5. The S&P 500 dropped below its 20 day moving average.

6. Apple Inc. (AAPL) dropped over 3% after U.S. District Judge Yvonne Gonzalez-Rogers ruled against Apple, saying that the company must let app developers direct their customers to alternate payment methods outside of the App Store.

7. Tesla (TSLA) dropped 2.46% after report says Cathay Wood has been selling the stock.

8. Alphabet (GOOG) dropped 2.07%. The DOJ is reportedly preparing another lawsuit against Alphabet in addition to the legal action from October 2020 under the previous administration.

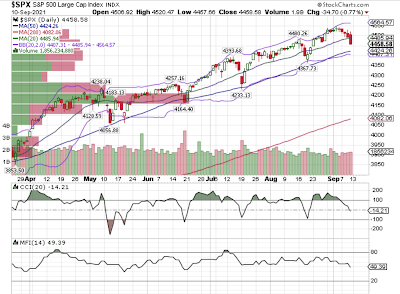
With the Dow and NYSE Composite ($NYA) dropping below their critical 50 day moving average and the S&P 500 below 20 day moving average and major tech stocks are reversing and dropping big,  a market selloff likely has begun. For the S&P 500, a drop to 50 day moving average 4424 would be a 2.7% drop from all time high, a drop of 5% from all time high would mean a drop to 4318 and a drop to 200 day moving average 4082 would mean a drop of 10.2% from all time high. A shallow drop of 2.7% doesn't look reasonable and I think at least a drop of 5 to 10% from all time high is likely. 


Dip buyings have been failing:


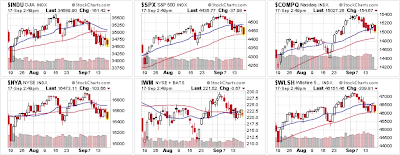
Stock Indexes are not behaving well:


Major tech stocks are reversing down:


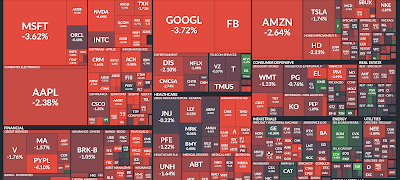
Most of the S&P 500 sectors are down Friday and the week (sourced from Finviz.com) :


标准普尔 500 指数本周已连续 5 天下跌。本周累计仅下跌了 1.7%。在过去的 9 个交易日中,明显逢低买进活跃,但都遭遇了更大的抛售。总体结果是市场下跌,这意味着逢低买入不再能够维持市场的上涨趋势。周五的跌幅是过去 5 天跌幅最大的。引发周五抛售的一些事件是:

1. 8月生产者价格指数连续第8个月上涨,同比上涨8.3%,是自2010年11月首次计算数据以来的最大12个月涨幅。

2. 高盛将第三季度 GDP 预测从 8 月 20 日的 5.5% 下调至 3.5%。

3. 美国国债下跌,收益率上升。

4. 道琼斯工业平均指数连续 2 天低于 50 天移动平均线。

5. 标准普尔 500 指数跌破 20 天移动平均线。

6. 苹果公司 (AAPL) 下跌超过 3%,此前美国地方法官伊冯娜·冈萨雷斯-罗杰斯 (Yvonne Gonzalez-Rogers) 对苹果作出裁决,称该公司必须让应用开发商指导其客户使用 App Store 以外的其他支付方式。

7. 报道称Cathy Wood一直在出售Tesla股票后,特斯拉 (TSLA) 下跌 2.46%。

8. Alphabet (GOOG) 下跌 2.07%。据报道,除了前任政府从 2020 年 10 月开始的法律诉讼之外,司法部正在准备另一项针对 Alphabet 的诉讼。

随着道琼斯指数及纽约证交所综合指数跌破关键的 50 天移动平均线,标准普尔 500 指数跌破 20 天移动平均线及主要科技股的大幅反转下跌,市场抛售可能已经开始。对于标准普尔 500 指数而言,跌至 50 天移动平均线 4424 将意味着从历史高点下跌 2.7%,从历史高点下跌 5% 将意味着跌至 4318水平,跌至 200 天移动平均线 4082 意味着从历史最高点下跌 10.2%。以目前情况看来 2.7% 的小幅下跌看起来并不合理,我认为可能会从历史最高点最小下跌 5% 至 10%。


逢低买入一直失败:


股票指数表现不佳:


主要科技股正在逆转下跌:


标准普尔 500 指数的大部分板块在周五和本周都下跌 (源自finviz.com):