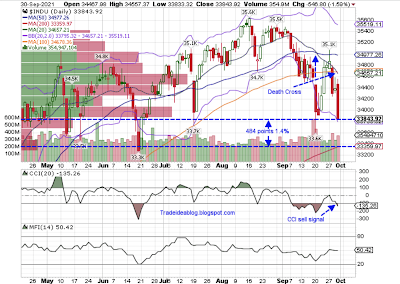
September is still keeping its bad name as the worst month of a year for the stock market as Dow, Nasdaq and SP500 dropped 8.5%, 5.5% and 3.9% in September respectively. Here is a look of these major market indexes:
The Dow is 5% below its all time high level 35631. It has two bearish death crosses on its daily chart. CCI dropped below -100 is a sell signal. It is below 20,50 and 100 dma, so its short and intermediate trends are now down. It is now 484 points, 1.4% above its 200 dma at 33360. It looks ready to test it since it is so close.
The Nasdaq Composite is below its all time high level 15403. In the daily chart, $compq is below its 20, 50 and 100 dma, and its short and intermediate trends are down. The next level to challenge is 200 dma at 13950, and it is 499 points, 3.5% below the present level at 14448.
The S&P 500 is 5.2% below its all time high 4546. Its 20 dma is crossing below its 50 dma forming a bearish death cross. CCI dropped below -100 is a sell signal. It is also below 20, 50 and 100 dma and its short and intermediate trends are down. Its next level of support is 200 dma 4135 which is 173 points, 4% below the current level of 4308.
Since the Dow is the closest to its 200 dma 33360 and this level will likely be tested near term. And it is likely serve as the market's support. The market will likely bounce when this level is touched. After finish bouncing, the market will likely proceed to test the 200 dma of S&P 500 at 13950 since it is the second closest. It this level fail to hold, the Nasdaq Composite 's 200 dma l3950 will be tested.
由于道指、纳斯达克指数和 S&P500 指数在 9 月分别下跌了 8.5%、5.5% 和 3.9%,9 月仍然保持是股市一年中最糟糕的月份坏名声。以下是这些主要市场指数的现时情况:
道琼斯指数目前比历史高点 35631 低 5%。它在日线图上有两个看跌的死亡交叉。CCI 有叠穿-100的卖出信号。它也低于 20,50 和 100 日平均线,其短期和中期趋势现在为下跌。它现在高于 200 日均线 33360 1.4%,484 点。它看起来已经准备好测试200 日均线,因为它是如此接近。
标准普尔 500 指数比历史高点 4546 低 5.2%。其 20 日均线下穿 50 日均线,形成看跌的死亡交叉。它同时有CCI向下穿-100的卖出信号。它也低于 20、50 和 100 日均线,其短期和中期趋势正在下跌。它的下一个支撑位是 200 日均线 4135,比当前水平 4308低 173 点,4%。
由于道指最接近 200 日均线 33360,该水平可能会在短期内受到测试。它很可能成为市场的支撑。当触及该水平时,市场可能会反弹。完成反弹后,市场可能会继续测试标准普尔 500 指数的 200 日均线 13950,因为它是第二最接近的。如果这一水平守不住,纳斯达克综合指数的 200 日均线l3950 将受到考验。


No comments:
Post a Comment