Wednesday, August 28, 2019

Time To Bet Aggressively For The Market Downside? 是时候积极押注股市下行了吗?

The 4 major market indexes are up on average 0.7% today ignoring intensifying US/China trade war and yield curve inversion which points to recession. I believe today's market rise is technical related as the Dow bounce after hitting 200 day moving average support. Month end fund buying also helps. The Dow is now bounded by 200 day moving average support at 25615 and 20 day moving average resistance at 26022. The overall Dow trend is down.  The Dow is more likely resolve to the downside eventually.  If 26022 breaks, Dow goes towards June low 24680 (-10% from all time high) and December low 21712 (-21% from all time high). A curious thing is that even though the US stock market is moderately down today but VIX is relatively stable.  This indicates smart money is buying hedge. Looking back to the history of VIX price behavior, it literally can double in price in matter of days if the timing is right. For aggressive trader, it may be time to load up on VIX for great gains. Followings are negatives for the market to think about:

US/China Trade War Intensified
Both China and US retaliated on tariff hike on each other's products starting September and December.

Global economic slow down
German GDP and Chinese Industrial Production are weaker than expected. Fed chairman Powell express concern over deteriorating economy conditions on China and Germany.

Yield Curve Inversion
The spread between the 10-year Treasury yield and the 2-year rate fell to negative 5 basis points, its lowest level since 2007. This is called a yield curve inversion. Experts fear it because in the past it has preceded recessionary periods. 3-month Treasury bill rate also traded higher than the 30-year bond yield. The yield curve is doing something that it hasn't done in 12 years.

Investors Are Buying Hedges
Gold (GLD), Tresury Bonds (TLT) and Utility Stocks (XLU) are all up around 20% from start of this year. Fear gauge VIX is up over 60% since end of July this year.

Insider Selling
Corporate insiders have sold an average of $600 million of stock per day in August, according to TrimTabs Investment Research, which tracks stock market liquidity. August is on track to be the fifth month of the year in which insider selling tops $10 billion. Other times that has happened was 2006 and 2007, the period before the last bear market in stocks, TrimTabs said.

Weak FAANG Stocks
FAANG, the famous abbreviation for FB, AAPL, AMZN, NFLX and GOOG has been the key to market directions. Since they are big cap tech stocks, they lead and the general market follows. FAANG has been under performing the general market as these stocks on average have dropped around 13% from their all time high while the bench mark S&P 500 is only down 5% from its all time high.  It seems there is a lot the general market need to catch up on the downside. Perfomances for the FAANG stocks in bad to worst order are AAPL -7.4%, GOOG -7.9, FB -12,8%, AMZN -13.5% and NFLX -24.5%. FB and AMZN are in correction while NFLX are in full blown bear market.


今日4大主要市场指数平均上涨0.7%,无视美中贸易战加剧和收益率曲线反转(这指向经济衰退)。我认为今天的市场上涨与技术有关,因为道指触及200日均线支撑而反弹。月末基金买盘的支撑也有关系 。道琼斯指数现在受到200日均线支撑位25615和20日均线阻力位26022的影响。整体道指走势看跌。道指有可能最终决定下行。如果26022被击穿,导指则会走向6月低点24680 (从历史高位下跌10%)和12月低点21712(从历史高位下跌21%)。奇怪的是,即使今天美国股市有中等程度下跌,但VIX相对稳定。 这表明聪明的资金正在买入对冲。 回顾VIX价格行为的历史,如果看对时机,它实际上可以在几天内翻番。 对于激进的交易者来说,现在可能是时候买入VIX以期获得异乎寻常的收益。以下列出要关注对股市负面的因素:

美中贸易战加剧
从9月和12月开始,中国和美国都对双方产品增加关税进行互相报复。

全球经济放缓
德国GDP和中国工业生产均弱于预期。美联储主席鲍威尔对中国和德国经济状况恶化表示担忧。

收益率曲线倒挂
10年期国债收益率和2年期利率之间的利差降至负5个基点,为2007年以来的最低水平。这称为收益率曲线倒挂。专家们都为此担心,因为它过去曾经导致衰退。 3个月国库券利率也高于30年期国债收益率。收益率曲线正在做一些它在12年内没有做过的事情。

投资者正在购买避险产品
黄金(GLD),美国国债(TLT)和公用事业股票(XLU)均从今年年初开始上涨了约20%。恐惧指数VIX自今年7月底以来上涨了60%以上。

内幕人士抛售股票
根据跟踪股市流动性的TrimTabs Investment Research的数据,8月份企业内部人士每天平均售出6亿美元的股票。 8月有望成为年度内部销售额达到100亿美元的第五个月。 TrimTabs表示,其他时期有同样情况发生的是2006年和2007年,这是股市最后一次熊市之前的时期。

FAANG的弱势
FAANG,着名的FB,AAPL,AMZN,NFLX和GOOG的缩写代号 一直是市场方向的关键。由于它们是大型科技股,它们领先而整体市场会紧随其后。由于FAANG一直的表现都坏于整体市场表现,这些股票平均从历史高点下跌约13%,而标准普尔500指数从历史高点仅下跌了5%,大市若要要赶上FAANG的下行幅度,还需要跌得更多。FAANG股票表现从坏到最坏的排列顺序为AAPL -7.4%,GOOG -7.9,FB -12,8%,AMZN  -13.5%及NFLX -24.5%。 FB和AMZN均在修正中,而NFLX则处于全面熊市中。


Tuesday, August 27, 2019

What Stocks Might Lead The General Market Down 那些股票可能导致整体市场下跌

FAANG, the famous abbreviation for FB, AAPL, AMZN, NFLX and GOOG has been the key to market directions. Since they are big cap tech stocks, they lead and the general market follows. FAANG has been under performing the general market as these stocks on average have dropped around 13% from their all time high while the bench mark S&P 500 is only down 5% from its all time high.  It seems there is a lot the general market need to catch up on the downside.

Perfomances for the FAANG stocks in bad to worst order are AAPL -7.4%, GOOG -7.9, FB -12,8%,
AMZN -13.5% and NFLX -24.5%. FB and AMZN are in correction while NFLX are in full blown bear market.

FNGU the 3 X FANG+ stock ETN which tracks FAANG and 5 other tech stocks is a good way to track momentum stocks. FNGU holdings include FB, AAPL, AMZN, NFLX, GOOG, TSLA, NVDA, BIDU, BABA and TWTR, each has 10% weighting. FNGU has dropped 63% (remember FNGU is a 3X ETN) from it's all time high is also alarming.

With FAANG and FNGU not doing well, we need to be really careful about the general stock market!


FAANG,着名的FB,AAPL,AMZN,NFLX和GOOG的缩写代号 一直是市场方向的关键。由于它们是大型科技股,它们领先而整体市场会紧随其后。由于FAANG一直的表现都坏于整体市场表现,这些股票平均从历史高点下跌约13%,而标准普尔500指数从历史高点仅下跌了5%,大市若要要赶上FAANG的下行幅度,还需要跌得更多。

FAANG股票表现从坏到最坏的排列顺序为AAPL -7.4%,GOOG -7.9,FB -12,8%,AMZN  -13.5%及NFLX -24.5%。 FB和AMZN均在修正中,而NFLX则处于全面熊市中。

跟踪FAANG和其他5只科技股3倍表现的ETN FNGU是跟踪动量股的好方法。 FNGU控股包括FB,AAPL,AMZN,NFLX,GOOG,TSLA,NVDA,BIDU,BABA和TWTR,每个都是10%的权重。 FNGU已经从它的历史高位下降了63%(记住FNGU是一个3X ETN)也是惊人的。

由于FAANG和FNGU都表现不佳,我们需要对美股大市非常谨慎!


Friday, August 23, 2019

Stock Market Downside Reversal Confirmed 股市逆转下行确认

The followings confirmed stock market's downside reversal:


1.  Trump vows to retaliate to China "this afternoon", orders US companies to find "an alternative to China".

2. Fed Chair Powell pledges to act appropriately to sustain economy and concern over deteriorating economy conditions on China and Germany. Now that his speech is over, the stock market will be focusing on worsening US/China trade war. Profit taking selling is likely.

3. Volatility Index VIX surged nearly 22%.  Fear is back.

4. Market downside reversal confirmed as major market indexes find resistances at their 50 day moving averages. August and lows are to be retested.  August lows are Dow 25340, S&P 500 2822 and Nasdaq Composite 7663. June lows are Dow 24680, S&P 500 2729 and Nasdaq Composite 7292.


以下证实股市已逆转下行:


1。特朗普誓言“今天下午”向中国报复,命令美国公司寻找“替代中国的渠道”。

2。美联储主席鲍威尔承诺采取适当行动以维持经济和对中国及德国经济状况恶化的担忧。 现在他的演讲已经结束,股市将关注美中贸易战的恶化。 股市将遭到获利抛售。

3。波动指数今天大升近22%。恐慌回来了。

4。市场下行逆转得到确认,因为主要市场指数难以突破它们的50日移动均线阻力。 8月及6月低点将重新被测试。8月低位为道指25340,标准普尔500 2822和纳斯达克综合指数7663, 6月低位为道指24680,标准普尔500 2729和纳斯达克综合指数7292。


Thursday, August 22, 2019

Classic Reversal Down For The Nasdaq Composite 纳斯达克综合指数的经典向下逆转

After bouncing from support for the last few days, the Nasdaq Composite has touched its 50 day moving average resistance at 8051 this morning and reversed to the downside. A Bearish Engulfing pattern which engulfed the range for the last 3 days is formed. If this pattern persists until today's market close, a downside reversal would be confirmed and the Nasdaq Composite will likely proceed to go down and test its August low at 7663. This market reversal is triggered by the following news headlines this morning, they are:

1.  Both Kansas City and Philadelphia Fed presidents said that they don't favor further interest cut.

2. August service PMI tumbled to 50.9, down from 53.0 in July, matching the lowest print in at least 3 years, and well below the 52.8 consensus expectation.

3. US manufacturing PMI unexpectedly tumbled into contraction territory at 49.90, down from 50.4 last month, and badly missing expectations of a 50.5 rebound. This was the first print below the 50.0 expansion threshold for the first time since September 2009.


在过去几天从支撑位反弹之后,纳斯达克综合指数今早已触及50日均线阻力位于8051,并逆转下行, 形成了吞没过去3天交易范围的看跌吞没模式。如果这种模式持续到今天收盘,则下行逆转将被证实,纳斯达克综合指数将继续下行并测试其8月低点7663。这一市场逆转是由今天上午的新闻头条引发的,它们是:

1。堪萨斯城和费城联储主席都表示他们不赞成进一步削减利息。

2。8月服务业PMI从7月的53.0跌至50.9,与至少3年的最低水平相当,远低于52.8的预期。

3。美国制造业采购经理人指数出乎意料地跌至收缩区域49.90,低于上个月的50.4,并严重低于预期的50.5反弹。这是自2009年9月以来首次低于50.0扩张门槛的数据。


Wednesday, August 21, 2019

I Use Netflix But Don't Like It's Stock 我用Netflix但不喜欢它的股票

Netflix (297.81 ) returned 6000% since 2009, from around 7 to its all time high at 423 this June. However, it has given up nearly 30% from its high. The stock has topped out and looks has a lot more downside:

1. NFLX daily chart shows that price is below its 20, 50 and 200 day moving averages, so its short, intermediate and long term trends are all down. It has entered a bear market since it dropped 30% from its high. It is the first FAANG stock that has entered a bear market.


2. NFLX weekly chart shows its next downside target is December 24 low at 231.


3. NFLX monthly chart shows a clear Double Top pattern. It likely trend towards its fibonacci support levels as shown in the blue lines. At which level it find support depends on its future fundamentals.


4. Competitions from Disney, AT&T, Apple and Amazon are diluting business and going to hurt Netflix.

5. High Debt/Equity ratio at 2.06 while the same ratio for DIS, AMZN, T and AAPL are 0.64, 0.76. 0.93 and 1.12 respectively. PEG is a very high 2.56 compare with 1.28 in the same industry.

6. In June and July of this year, 5 analysts raised NFLX price target to 440, 442, 380, 370 and 515 separately. NFLX has been down since the target raises,  these targets may need to revise downward since the stock is now trading at 297.81 only.

7. Investors.com Composite Rating for NFLX is a failed fundamental grade at 50 and NFLX Accumulation/ Distribution Rating is E, the worst grade possible, indicates people are selling.


Disclosure: I own NFLX Put


Netflix(297.81)自2009年以来的回报率为6000%(从7左右到今年6月的历史最高点423点)。然而,它已经从高位下跌了近30%。股票已经见顶,看起来会有更多的下行空间:

1。NFLX日线图显示价格低于20日,50日和200日均线,因此其短期,中期和长期趋势均下跌。它已进入熊市因为它从高点已下跌了30%。这是第一只进入熊市的FAANG股票。


2。NFLX周线图显示其下一个下行目标是12月24日的低位231。


3。NFLX月线图表显示了明显的双顶模式。它将跌向蓝线所示的各个斐波那契支撑位。它在那个水平找到支撑取决于其未来的基本面发展。


4。迪士尼,AT&T,苹果和亚马逊加入这个行业的竞争将稀释生意对Netflix造成伤害。

5。债务/权益比率为2.06,而DIS,AMZN,T和AAPL的相同比率分别只为0.64, 0.76, 0.93和1.12。PEG 为很高的2.53, 同行业PEG只为1.28。

6。今年6月和7月间,5名分析师分别将NFLX的目标价格上调至440, 442, 380, 370和515。上调后NFLX便一直在跌,这些目标价都有可能被向下修正,因为该股目前的交易价格仅为297.81。

7. Investors.com NFLX的综合评分为50,这是不合格的基本面评分,而NFLX累积/分发评级为E级,是最差的级别,显示人们在卖股。


披露:我持有NFLX Put


Friday, August 16, 2019

Follow Up On GE GE的再跟进

GE (8.79)

Madoff whistleblower Harry Markopolos accused GE of deceiving fraudulent financial statements to cover up its problems in a 175-page "whistle-blower report" yesterday and the GE stock dropped 11% yesterday. After the accusation, GE CEO Larry Culp bought nearly $2 million worth of the company's stock on Thursday and denied fraud accusations (but this action is being forced and doesn't mean much). On top of that 2 analysts and short selling firm Citron also came out and defended the stock.  GE is up nearly 9% today. Will these reverse GE stock's down side fate ? I believe not and here are the reasons:

1.  When a famous whistleblower putting his creditability on line,wrote a 175 page report about GE's misbehavior, there must be something wrong even if the accusations may not be all true. Harry Markopolos is one of many to accuse GE of faulty accounting according to Herb Greenberg, Pacific Square Research, and Thomas Ajamie, Ajamie LLP.  DOJ and SEC have been looking into some of these accusations. This makes Harry Markopolos accusation more creditable.

2. Investors.com's Composite Rating for the stock is only 18 out of 99 and the Accumulation/ Distribution Rating is D-, A+is the best rating, both indicate a sell for the stock. Why would anybody want to buy this weak stock? Just because it's a big name? This big name stock lost 70% of its value from July 2016's
high of 29.33 to today's 8.79. Does it still worth trusting with this disaster performance?

3. GE stock traded between 9 and 11.75 range for 6 1/2 month. The breaking below this range is a severe technical blow to the stock, since 9 is now a brick wall resistance and will likely be tough to get through. Technically, it likely will go down and retest Aug 15, 2019 low of 7.65 then December 2018 low of 6.38.


Disclosure:I own GE Put.


GE (8.79)

马多夫(Madoff )举报人哈里马可波罗斯 (Harry Markopolos )昨天在其175页的“举报报告”中指责通用电气欺诈性财务报表以掩盖问题,通用电气股票昨日下跌了11%。在被指控之后,通用电气公司首席执行官拉里·卡尔普 (Larry Culp)周四购买了该公司近200万美元的股票,并否认了欺诈指控 (但此举是被迫的举动,不能代表什么)。除此之外,2位分析师和卖空公司Citron出来为该股进行了辩护。今天GE因而上涨了近9%。GE股票会继续反转向上吗?我相信不会,原因如下:

1. 当一位着名的告密者将他的信誉做抵押,写了一份175页的关于GE不当行为的报告,即使指控可能不全是真的,GE却一定有什么不妥。根据太平洋广场研究中心的Herb Greenberg和Ajamie LLP的Thomas Ajamie的说法,Harry Markopolos只是指控GE会计错误的众多人之一。司法部和美国证券交易委员会一直在调查其中的一些指控。这使Harry Markopolos的指控更加可信。

2. Investors.com对该股票的综合评分仅为18,而99为满分,累积/分发评级仅为D-,满分为A+,两者均表示该股票应该卖出。为什么有人要购买这种弱势股票呢?仅仅因为它是一个名牌公司吗?从2016年7月高点的29.33至今天的8.79,这个名牌公司的股价已经下跌了70% ,这么不好的表现还值得信任吗?

3. GE股票在过去的6个半月交易于9至11.75之间。跌穿该区间的下限价位是对该股的严重技术破坏,因为9现在就好像一堵砖墙,是很难超越的阻力。从技术上讲,它可能再会下跌并重新测试2019年8月15日的低点7.65,然后测试2018年12月的低点6.38。


披露:我持有GE Put。


Thursday, August 15, 2019

GE In Trouble GE 麻烦大

GE (7.93 )is looking bearish as it's accused of accounting fault and very weak technicals, strategy is sell on rallies:

。General Electric—Shares of GE plummeted as much as 14% shares after Madoff whistleblower Harry Markopolos accused the company of deceiving fraudulent financial statements to cover up its problems in a 175-page "whistle-blower report" . Markopolos took aim at past and present Executives in his report and said that GE is “a bigger fraud than Enron and Worldcom" ---CNBC, Aug 15, 2019

。Harry Markopolos alleges GE, the struggling conglomerate has masked the depths of its problems, resulting in inaccurate and fraudulent financial filings with regulators. GE's insurance unit will need to bolster its reserves by $18.5B in cash and faulted the way the company is accounting for its oil-and -gas business. All told, the accounting problems amount to $38B, or 40% of the conglomerate's market value. ---SeekingAlpha.com,Aug 15,2019

。"The sale of GE Biopharma will improve GE's credit metrics.
In Q2, GE may have lost its one remaining moat.
I estimate GE's pro forma debt after the Biopharma sale would be considered junk.
An enormous debt load and no moat is troubling. Sell GE."
  ---Shocking The Street via SeekingAlpha.com,Aug 13,2019

。The options for expiration on September 20 saw their open interest levels rise by almost 40,000 contracts on August 13, to around 123,000 contracts for the $9 puts. That compares to roughly 4,000 open call contracts at the same strike price. Open interest at that strike price has risen sharply since July 31.
The technical chart suggests the stock can fall further.
---Mott Capital Management via SeekingAlpha.com, Aug 13, 2019

。Technically, GE has formed a 6 1/2 month the most bearish Island Reversal pattern. It is also below 20, 50 and 200 day moving averages. Its trend is down. Supports are 7.5 then 6.38 all time low. Resistance is today's high at 8.63.


Disclosure:I own GE Put.


GE (7.93 ) 由于它被指责有欺诈性财务报表和技术上非常弱势,GE趋势继续看跌, 策略是逢高卖出:

。在麦道夫(Madoff)举报人哈里马可波罗斯 (Harry Markopolos)举报 GE有欺诈性财务报表以掩盖其175页“举报报告”中的问题后,通用电气股份通用电气股价暴跌14%。 Markopolos在他的报告中瞄准了过去和现在的高管,并说GE有“比安然(Eron)及Worldcom更大的欺诈行为。”--- CNBC,2019年8月15日

。Harry Markopolos声称通用电气这家陷入困境的企业集团掩盖了其问题的深度,导致与监管机构提交的财务申报不准确和欺诈。通用电气的保险部门将需要以185亿美元的现金支持其储备,并对公司的石油和天然气业务进行会计处理。总而言之,会计问题达到380亿美元,占集团市值的40%。 --- SeekingAlpha.com,Aug 15,2019

。“出售GE Biopharma将改善GE的信贷指标。
在第二季度,通用电气可能已经失去了一条剩余的护城河。
 我估计通用电气在卖出生物制药部门后债务被视为垃圾级。
巨大的债务负担和没有护城河是令人不安的。卖出GE。“
  ---震惊街道,来自SeekingAlpha.com,8月13,2019

。9月20日到期的期权在8月13日的未平仓合约上涨了近40,000份合约,9美元看跌期权合约约为123,000份合约。相比之下,同一行使价的看涨期权合约只约为4,000份。自7月31日以来,该执行价格的未平仓合约大幅上涨。
技术图表显示股票可能进一步下跌。
---莫特资本管理公司,通过SeekingAlpha.com,2019年8月13日

。技术上,通用电气图表已形成6个半月最负面的岛形反转模式。它也低于20日,50日和200日移动平均线。它的趋势是下跌。支撑为7.5,然后是6.38。阻力为今天高位8.63。


披露:我拥有GE Put。


Wednesday, August 14, 2019

Dow Looks Ready to Break Down 道指看来在崩溃边缘

The US stock market has been volatile since end of July. Since July 31, the highest daily Dow range is 736 and the low daily range is 315 and the 11 day average is 485. The Dow tested its 200 day moving average at 25585 the third time during the last 1 1/2 weeks. The first two tests attracted buying and the Dow bounced off 25585.  But, this time it may not able to hold as weak reports on China's Industrial Production and German's GDP that caused US 10 year bond yield goes lower than that of the 2 year's which raised recession odd. Other worries are US/China trade war doesn't seem to end soon, unsettling Hong Kong situation and Argentina at risk of debt default and Pakistan/India on edge of war. Technically, if the Dow breaks below 25585 level , a bearish Reverse Cup And Handle pattern will be formed and the May low at 24680 will likely be tested. It would be down 9.9% from the all time high of 27398 to 24680.


自7月底以来,美国股市一直波动。 自7月31日到今天,道琼斯指数每日最大交易区间为736,最小交易区间为315,11日平均值为485。道琼斯指数在过去1 1/2周内第三次测试其200日均线25585。 前两次测试都吸引了买盘,道琼斯指数从25585反弹。但是,这次可能无法守稳因为中国工业生产和德国国内生产总值的疲软报告导致美国10年期债券收益率低于2年期债券收益率,着增加了经济衰退的可能性。 而美国/中国的贸易战看来不会很快结束,香港局势仍然不稳定,阿根廷面临债务违约和巴基斯坦/印度处于战争边缘的风险令人不安。 从技术面来看,如果道指跌破25585水平,将形成看跌的反向杯状形态,并可能测试5月低点24680。24680水平是从历史高点27398下跌9.9%。


Friday, August 9, 2019

The Best Stock To Buy Today 今日是最好时机买入的股票

OSTK( 24.09)

。OSTK reported better  than expected earnings yesterday.
。Two analysts up price target to 40 and 48 today. And consensus price target is 41.
。Short percentage is 62% on float of 28.26 million only, short squeeze is on.
。Investors.com Accumulation/Distribution is A+.
。Huge move today on heavy volume. Today's price range engulfs last 8 days of range.
。Stock breaking above 23.86 means it's moving towards 28 then 30.


OSTK(24.09)

。OSTK昨天报告的盈利好于预期。
。两位分析师今日将价格目标定为40和48。 而所有分析师共识价格目标是41。
。仅有2826万的浮动股而卖空白份比为极高的62%,逼空在进行中。
。Investors.com累积/分发评分是A +。
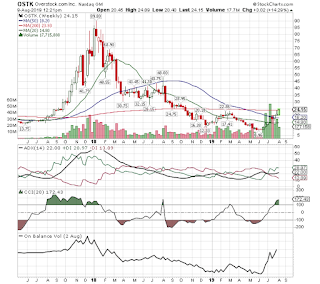
。今天放量大升。 今天的价格范围吞没了过去8天的范围。
。股票突破23.86意味着它正走向28然后30。


Wednesday, August 7, 2019

Stock Market Trend Is Down But Will Bounce First 股市趋势向下但将首先反弹

The US stock market has been volatile for the last few days but it also has created a clear trading
environment. The Dow, S&P 500 and Nasdaq Composite all have dropped about 5% from their all time high levels and are below their 20 and 50 day moving averages.  So it is easy to say that the US stock market trend has now reversed from up to down. Market strategy is to sell on rallies. All 3 major market indexes are now bounded by 200 and 50 day moving averages and the market will likely trade within these levels short term.  Since the Dow has touched and bounced off its 200 day moving average 25560 level twice, it is only natural for it to bounce towards 50 day moving average 26502. Due to the big downside momentum generated since the end of July, the worsening US/China trade war and the concern over global economy, it is not likely it can recover above 50 day moving average. Before challenging its 50 day moving average ,there are 38%, 50% fibonacci resistances to overcome. It is more likely that the 200 day moving average level will be test and broken soon after a brief bounce, it may then proceed to test its May low at 24680. The above described possible move for the Dow. The S&P 500 and Nasdaq Composite movements should be similar as in the following charts.


美国股市在过去几天一直很波动,但它也创造了一个明确的交易环境。道琼斯指数,标准普尔500指数和纳斯达克综合指数均从历史高点回落约5%,并且低于20日和50日移动均线。所以很容易说美国股市的走势现在已经从上到下逆转。市场策略是逢高卖出。所有3个主要市场指数现在都处于200和50日均线之间,市场短期内会在这些水平内交易。由于道琼斯指数曾两次触及200天移动平均线25560水平,因此自然地会向50日移动平均线26502反弹。由于7月底以来产生的巨大下行势头,美国/中国日益恶化的贸易战和对全球经济的担忧,它恢复到50日均线以上的可能性不大。在挑战其50天移动平均线之前,它还需要克服38%,50%的斐波纳契阻力。 相信200天移动平均线水平更有可能在短暂反弹后很快会再被测试和被击破,而下探5月份低价24680。上面描述了道指可能的走势。 标准普尔500指数和纳斯达克综合指数走势也应该相似,请参考下图。